|
1. Quantitative measurement of binocular color fusion limit for
non-spectral colors
As 3DTV has spread,
it is necessary to measure how color differences between left and right
images of non-spectral colors as well as spectral colors initiate color rivalry.
In particular, the color fusion limit of non-spectral colors needs to be
measured in the color gamut of 3DTV. Thus far, no attempt has been made to
measure the color fusion limit for non-spectral colors. In this Research,
we measured the binocular color fusion limit for non-spectral colors within
the color gamut of a conventional LCD (Liquid Cristal Display) 3DTV. The
color fusion limit is measured for eight chromaticity points, covering the
entire area in the standard CIE 1976 u´v´
chromaticity diagram.
1.1. Visual stimulus
To cover the entire
area of the chromaticity diagram, we uniformly sampled the points in the
CIE 1976 uniform chromaticity scale diagram. Fig. 1 shows all eight sample
points in the CIE 1976 chromaticity diagram, where we measured the color
fusion limit. The numbers in Fig. 1 indicate the sample numbers to be
observed for the color fusion limit and the triangle represents the color
gamut of the LCD display used in our experiments. In the experiments, the
colors of the sampled points were presented for the right eye.
To prepare the
stimuli for the left eye, which were coupled with the stimulus given for
the right eye, we sampled neighbors along the straight lines of six directions
from the origin point given for the right eye. The six directions consisted
of:
• Three
main directions to the red (R), green (G), and blue (B) primaries.
• Three
sub-directions representing an equiangular division between R and G, G and
B, and B and R, respectively.
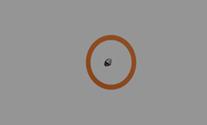
We used a black
background and a circular object filled with the sampled colors. The
binocular disparity was zero, indicating no depth perception. Fig. 2 shows
an example of a stimulus. It consists of different colors for the left and
right eyes.
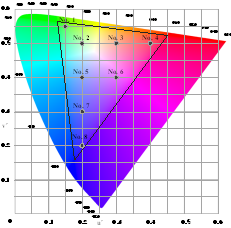
Fig. 1. The total of 8 sample points
in the CIE 1976 chromaticity diagram where we quantify color fusion limit
through our experiment.
The triangle represents the color gamut of the LCD display used in our
experiments. The numbers indicate the sample numbers (from No. 1 to No. 8).
These sample points were presented for the right eye. [1]

Fig. 2. Example of a stimulus used in
the binocular color fusion limit experiment (a) for the left eye and (b)
for the right eye.
The test field size was 2° in diameter, and the surrounding field size was
33°.
1.2. Results
For the eight
chromaticity points, the results of the color fusion limit were represented
as a series of ellipses. The semi-minor axis of the ellipses ranged from
0.0415 to 0.0923 in the Euclidean distance in the u´v´
chromaticity diagram while the semi-major axis ranged from 0.0640 to
0.1560. The shapes and directions of rotation of the ellipses were similar
to those of MacAdam ellipses for the
just-noticeable differences of chromaticity.
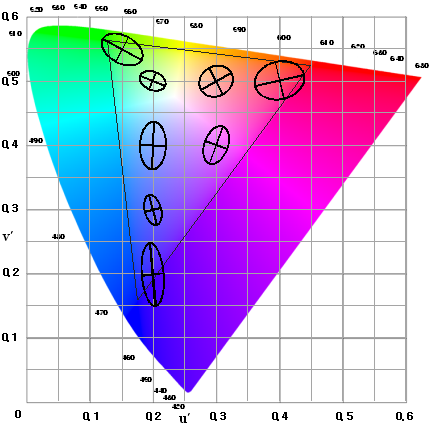
Fig. 3. Overall results of the color
fusion limit plotted on the CIE 1976 chromaticity diagram.
For clarity, the ellipses are downscaled to one third of their actual
lengths.[1]
[1] Y. J. Jung, H. Sohn,
S. Lee, Y. M. Ro, and H. W. Park, “Quantitative Measurement of Binocular
Color Fusion Limit for Non-spectral Colors,” Optics Express, vol. 19, no.
8, pp. 7325-7338, 2011 (also selected by the Editors for publication in the
most recent issue of the Virtual Journal for Biomedical Optics)
2. Subjective measurement of visual discomfort induced by
disparity characteristic
This experiment assesses the visual
discomfort induced by disparity magnitude. Psychophysical experiments have
been conducted to investigate the relationship between subjective visual
comfort and the amount of binocular disparity.
2.1. Visual stimulus
Fig. 4 shows an
example of the visual stimulus used in this experiment. The visual stimulus
consists of two overlapped squares and background. Luminance of the
foreground square and the surrounding square was respectively set to 50
cd/m2 and 25 cd/m2 (CIE daylight D65) with the field
size of 2º and 10º visual angles. To avoid the visual effect of background,
luminance of the background was set to 0 cd/m2. Note that the
size of visual field for the foreground square and the surrounding square
were determined to cover the size of the fovea and the parafovea
respectively. Binocular disparity was only given to the foreground square
in the range of +3.7º to –3.7º with a step size of
0.6 º, where positive polarity refers to crossed disparity while
negative polarity refers to uncrossed disparity.

Fig. 4. Visual stimulus used for subjective
assessment of the visual discomfort induced by disparity characteristics.[2]
2.2. Results
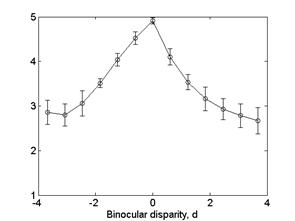
Fig. 5 shows the degree of visual
comfort with diverse amount of binocular disparities. In Fig. 5, x-axis
indicates binocular disparity while y-axis indicates a mean opinion score
(MOS). As shown in the figure, human observers reported higher degree of
visual discomfort as binocular disparity increases. Increase in binocular
disparity imposes higher operating load of human oculomotor
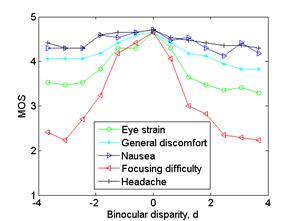
system, which may induce physiological symptoms of visual discomfort. Fig.
5(b) represents the degree of each symptom obtained from the questionnaire
according to the amount of binocular disparity. From the result, it can be
observed that as binocular disparity increases, overall symptoms of visual
discomfort become severe and its major symptoms are focusing difficulty and
eye strain.
|
|
|
|
(a)
|
(b)
|
Fig. 5. Visual discomfort induced by
binocular disparities: (a) MOS of visual comfort (b) the degree of each
symptoms of visual discomfort. [2]
[2] H. Sohn,
Y.J. Jung, S. Lee, H.W. Park, and Y.M. Ro, “Attention Model-Based Visual
Comfort Assessment for Stereoscopic Depth Perception,” IEEE International
Conference on Digital Signal Processing (DSP 2011), Greece
3. Subjective measurement of visual discomfort induced by
motion characteristics
This experiment assesses the visual
discomfort induced by planar motion and in-depth motion characteristics: 1) velocity of
horizontal motion: the average change in horizontal visual angle and
apparent depth for the planar motion, 2) velocity of vertical motion: the
average change in vertical visual angle and apparent depth for the planar
motion, and 3) velocity of in-depth motion: the average change in angular
disparity.
3.1. Visual stimulus
A set of visual stimuli was generated
with various velocities and directions of object motion using a computer
graphics tool. As shown in Fig. 6, these visual stimuli consisted of a grey
meteor object (chromaticity: D65, illumination: 25 cd/m2),
background (chromaticity: D65, illumination: 50 cd/m2), and a
guide for zero parallax position. A total of 49 visual stimuli were
generated (21 stimuli for horizontal motion, 21 stimuli for vertical
motion, and 7 stimuli for depth motion). 42 visual stimuli had horizontal
and vertical motions at seven different velocities, moving at 1°
crossed disparity, zero disparity, and 1° uncrossed disparity,
respectively. 7 visual stimuli had depth motion at seven different
velocities. The visual stimulus with horizontal and vertical motions
contained a pair of high contrast colored bars and the visual stimulus with
depth motion contained a high contrast colored ring. The bars and ring were
positioned at the zero disparity so as to provide a depth plane of reference
for viewers.
Fig.
6. Examples of visual stimulus. (a) Horizontal motion at 1° crossed
disparity; (b) vertical motion at 1° crossed disparity; and (c) depth motion.
For depth motion, the meteor object periodically moves back-and-forth
between 1° crossed disparity and 1° uncrossed disparity.[3]
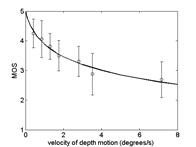
3.2. Results
3.2.1 Horizontal motion
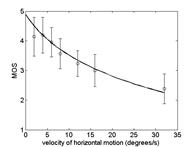
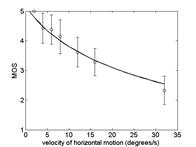
Fig. 7 shows the experimental results
of horizontal motion. In the figure, y-axis represents mean opinion score
of the perceived visual comfort and x-axis denotes velocity of horizontal
motion. The results show that increase in velocity of horizontal motion
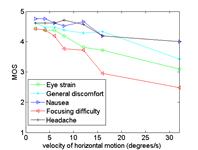
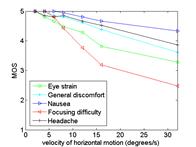
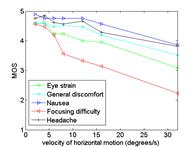
induces more visual discomfort. Fig. 8 represents the results of the
accompanied questionnaire. In the figure, y-axis is the severity of the
symptoms of visual discomfort (5: none, 1: severe). The x-axis of Fig. 8 is
the velocity of horizontal motion. The accompanied questionnaire reveals
that the subjects felt the focusing difficulty. This phenomenon was caused
by motion blur and motion judder in an object.
|
|
|

|
|
|
(a)
|
(b)
|
(c)
|
|
|
Fig. 7. Visual comfort models for horizontal motion, which
represent the relation between visual comfort and motion velocity. The
models were obtained by fitting the results of subjective assessment. (a)
1° crossed disparity; (b) zero
disparity; and (c) 1° uncrossed disparity. Error bars
represent standard deviation of median rating scores.[3]
|
|
|
|
|
|
|
(a)
|
(b)
|
(c)
|
|
Fig. 8. The degree of the symptoms of visual discomfort
for horizontal motion. (a) 1° crossed disparity; (b) zero
disparity; and (c) 1° uncrossed disparity.[3]
|
|
|
|
|
|
|
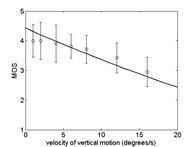
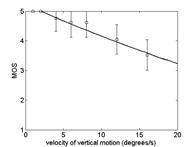
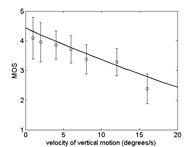
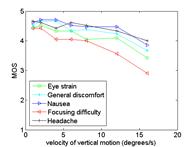
3.2.2 Vertical motion
Fig. 9 shows the experimental results
of vertical motion. As in the horizontal motion, more visual discomfort was
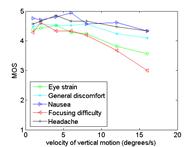
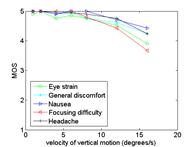
induced as the velocity of vertical motion increased. Fig. 10 represents
the result of the accompanied questionnaire. The accompanied questionnaire
reveals that the subjects have felt the focusing difficulty. This
phenomenon was caused by motion blur and motion judder in an object.
|
|
|
|
|
(a)
|
(b)
|
(c)
|
|
Fig. 9. Visual comfort models for vertical motion, which
represent the relation between visual comfort and motion velocity. The
models were obtained by fitting the results of subjective assessment. (a)
1° crossed disparity; (b) zero disparity; and (c) 1° uncrossed disparity.
[3]
|
|
|
|
|
|
(a)
|
(b)
|
(c)
|
|
Fig. 10. The degree of the symptoms of visual discomfort
for vertical motion. (a) 1° crossed disparity; (b) zero
disparity; and (c) 1° uncrossed disparity.[3]
|
|