|
◎ Stereoscopic 3D
images
|
A
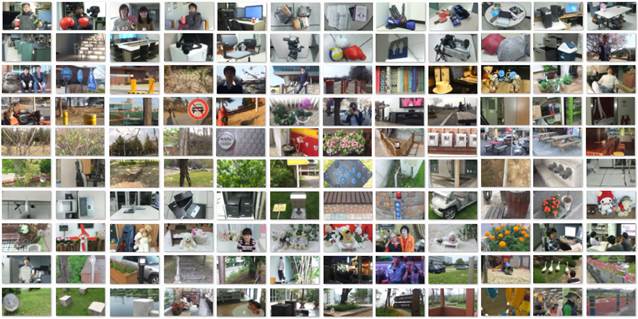
total of 120 real scenes were captured using a 3D digital camera with dual
lenses (Fujifilm FinePix 3D W3®). In
summary, the database consists of various types of images with a resolution
of 1920 × 1080 pixels. 62 of them are indoor scenes and the others are
outdoor scenes (see Fig. 1). These images contain various types of object
(humans, trees, structures, man-made objects, etc.). Twenty images include
human objects. The magnitude of maximum crossed disparity of each scene ranges
from 0.11 to 5.07 degrees in our experimental condition, corresponding to 0
to 285 pixels.
To
download the stereoscopic images, please click here
|
|
|
Fig. 1. A total of 120 stereoscopic images used
in our experiment.
◎ Subjective
assessment results
|
For subjective assessment experiments of visual
comfort, we used a linearly polarized stereoscopic monitor manufactured by Redrover (true3Di®). It consisted of a half
mirror and two 40" LCD displays. A spatial resolution of the monitor
was set to 1920 x 1080 pixels. The viewing distance (1500mm) was fixed to
about three times the height of the screen. The design of experimental
environments was in line with the recommendation of ITU-R BT.500-11. A
total of 20 subjects (non-experts) were recruited under approval of KAIST
IRB (Institutional Review Board). However, two subjects had abnormal
stereopsis according to the stereo fly test. A total of 18 subjects, aged
between 20 and 29 years, involved in this subjective assessment. All 18
subjects had normal or corrected vision and a minimum stereopsis of 60
arcsec (in the stereo fly test).
In test sessions, subjects assessed all 120
images that were randomly arranged. Display duration of each image was 10
seconds and the resting time was 5 seconds using a mid-gray image. During
the resting time, subjects were instructed to grade the overall level of
subjective visual comfort for each image by considering physiological
symptoms such as eye strain, general discomfort, headache, focusing
difficulty, and nausea. The adjectival categorical method of the Single
Stimulus (SS) method of ITU-R BT. 500-11 was used with a five-grading scale
of visual comfort (5: very comfortable, 4: comfortable, 3: mildly
uncomfortable, 2: uncomfortable, 1: extremely uncomfortable). After
collecting all subjective scores, we performed a screening analysis
recommended by ITU-R BT.500-11 (see Annex 2 in ITU-R BT.500-11). This screening
process allows discarding observers who have produced votes significantly
distant from the average scores. One subject was rejected after screening.
Consequently, mean opinion score (MOS) for each image was obtained from 17
subjects.
As shown in Fig. 2, the subjective assessment
results of visual comfort revealed that subjective scores of 6 images
ranged from “extremely uncomfortable” to “uncomfortable”. 16 images induced
from “uncomfortable” to “mildly uncomfortable”. 52 images induced from
“mildly uncomfortable” to “comfortable”. 46 images induced from
“comfortable” to “very comfortable”.
To evaluate the reliability of the subjective
assessment results, we computed the Cronbach’s
alpha that has been commonly used to measure the internal consistency of a
psychometric test score. With our subjective scores of visual comfort, the Cronbach’s alpha was computed as 0.98. Note that Cronbach’s alpha of 0.70 is considered acceptable. A
correlation analysis was also conducted as an additional means to evaluate
the consistency of the subjective assessment results. For the correlation
analysis, participants were divided into two independent halves, and then
the correlation between MOSs obtained from the two
groups was measured by the Spearman rank order correlation coefficient
(SROCC) for 100 random trials. This evaluated monotonic relation of MOSs
between two groups. As a result, 89% of SROCC was obtained.
To download the subjective assessment results,
please click here
|

Fig. 2. Subjective assessment results for visual
comfort of 120 stereoscopic images used in our experiment.
◎ The functional
parameters ( and and  ) used in
the equation (4) in the paper [1] (Please click here). ) used in
the equation (4) in the paper [1] (Please click here).
[1] Y. J. Jung, H. Sohn, S. Lee, H. W.
Park, and Y. M. Ro, “Predicting visual discomfort of stereoscopic images
using human attention model,” IEEE Trans. Circuits and Systems for Video
Technology (CSVT), 2013. (online publication)
Image
and Video Systems Lab, Department of Electrical Engineering,
Korea Advanced Institute of Science and Technology (KAIST),
Daejeon, Korea
Contact: Hosik Sohn, sohnhosik@kaist.ac.kr; Yong Ju Jung, yj.jung@kaist.ac.kr;
|