|
1. Background
n
Increase of interest in
stereoscopic 3D video
n
Concerns on 3D image
safety issues
–
Visual discomfort and
visual fatigue
•
Excessive screen
disparity, fast motion, and stereoscopic distortions
n
Needs of visual comfort metric and safety
guidelines
2. Proposed Attention Model-based Visual Comfort Metric
for Stereoscopic Videos
n
We employ 3D content
analysis and visual attention model to quantify causes of visual fatigue
n
Visual comfort (VC)
metric based on contents and visual
attention model
–
Motion and depth statistics of visual importance regions,
where human subjects pay more attention, are likely to play an essential
role in determining overall VC score.
–
Human attention model in
HVS

Fig. 1. The Proposed Attention Model-based Visual Comfort
Metric for motion characteristics [1].
3. Visual Importance Region
Detection for Attention Model-based Visual Comfort Metric
n
Perceptually significant
regions
–
Combination of image
attention model and motion attention model
–
Saliency-based measures
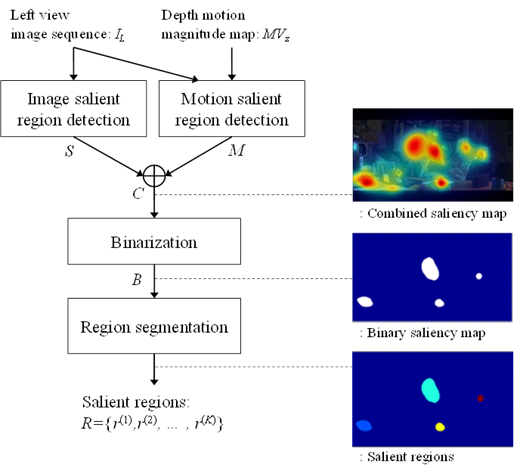
Fig. 2. Perceptually significant region extraction [1].
4. Perceptually
Significant Motion Features
n
Perceptually significant
motion features
–
Planar motion
•
Horizontal motion
velocity (in degree/sec)
•
Vertical motion velocity
(in degree/sec)
–
In-depth motion velocity
(in degree/sec)
5. Experiments:
subjective test
n
Experimental environment
–
Stereoscopic display:
40” half mirror type (linear polarization)
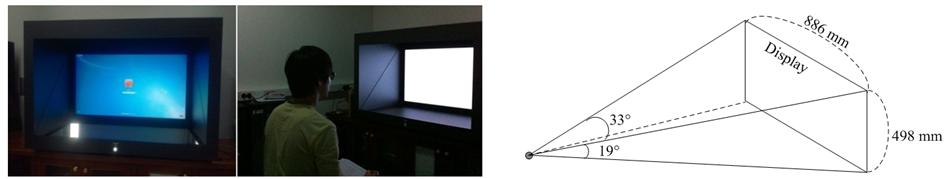
Fig. 3. Experimental environment [1].
n
Subjects
–
Number of subjects (non experts) recruited for subjective assessments:
•
40 for the experiment of
visual comfort model construction with synthetic video
•
20 for the validation
experiment with real stereoscopic video (3 subjects were rejected by the stereofly test and the screening test of ITU-R BT
500-11)
–
The subjects were
recruited under approval of KAIST IRB (Institutional Review Board)
•
All subjects had normal
or corrected vision and a minimum stereopsis of 60 arcsec
(in stereo fly test)
•
Aged between 20 and 37
years
n
Visual Stimulus used for
visual comfort model construction of motion stimuli
–
Object type: gray meteor
–
Field size of object: 2 degree
–
Background: Mid-gray (Illuminant D65, 50 cd/m2)
–
Foreground: Dark-gray (25 cd/m2)

Fig. 4. Visual Stimulus used for visual comfort model
construction of motion stimuli [1].
n
Visual comfort model for
motion characteristics
–
Mean of median rating scores to remove outliers
–
Fitting of the psychometric functions obtained by subjective
assessments
•
We obtained the fits to three log models in terms of movement
velocity for each directional motion (in agreement with Fechner’s log
law)
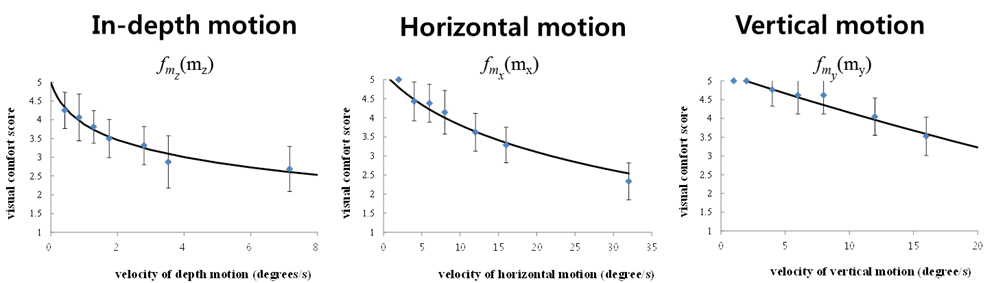
Fig. 5. Visual comfort model for motion characteristics
[1].
n
Evaluation of visual
comfort metric for motion characteristics
–
Number of real stereoscopic videos: 40
•
36 natural scenes captured using a 3D digital camera with dual
lenses (Fujifilm FinePix 3D W3) and 4 MPEG 3D
video test sequences
•
Various motion speed and motion directions (horizontal, vertical,
and depth motions)
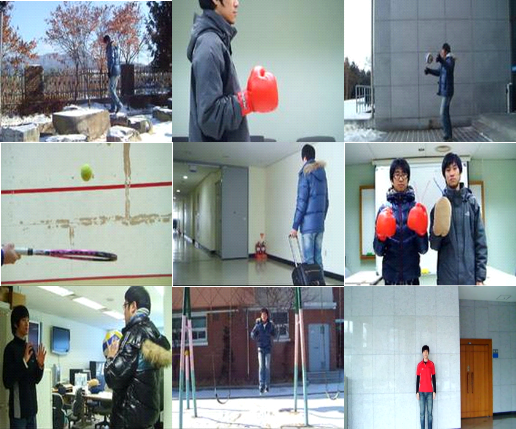
Fig. 6. Stereoscopic videos for evaluation of visual
comfort metric [1].
n
Evaluation results of
visual comfort metric for motion characteristics
–
The proposed attention model-based approach outperforms the global
statistics-based approaches
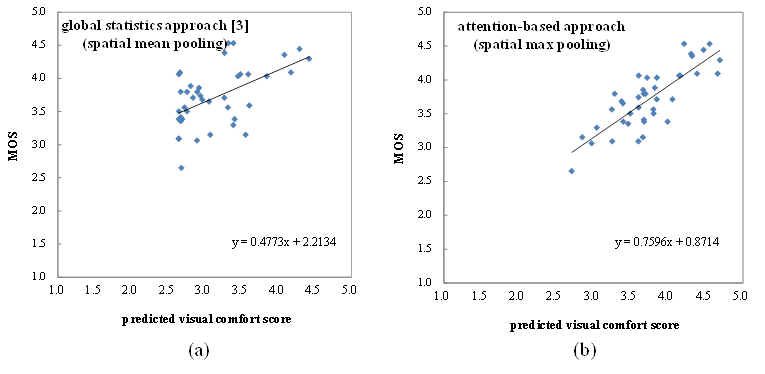
Fig. 7. Scatter plot between MOSs and predicted visual
comfort scores [1].
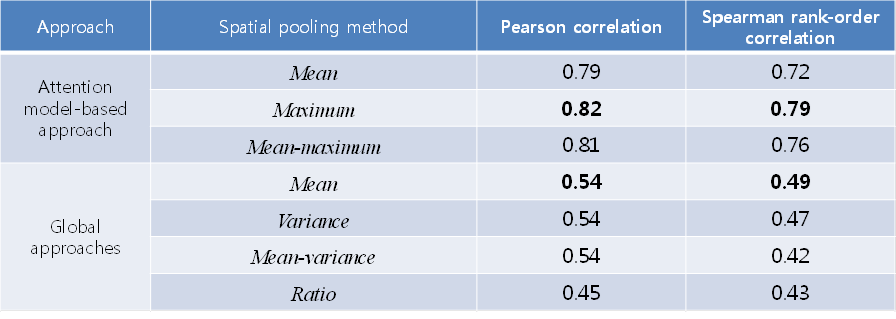
Table 1. Quantitative results of prediction performance:
Correlation measure between subjective MOSs and predicted visual comfort
scores [1].
|