|
1. Introduction
The
effects of breast cancer’s early detection in reducing the mortality rate
of that disease have been shown in many clinical studies. Until recently,
screening mammography has been considered as the gold standard for breast
cancer detection. However the conspicuity of masses is obscured by the
presence of overlapping tissue due to projecting three-dimensional (3D)
breast information into a two-dimensional a (2D) plane. This inherently
limits breast mass detection based on mammograms.
Recently, a new 3D tomographic imaging modality,
namely Digital breast tomosynthesis (DBT), has been introduced to
alleviate the overlapping tissue problem that can obscure breast masses.
In DBT, a series of low-dose projection view images are obtained with an
x-ray tube at different angles to the plane of the compressed breast over
a limited angular range. A 3D breast volume is reconstructed from the
limited number of projection view images using reconstruction algorithms.
Although DBT resolves the overlapping tissue problem, the 3D
reconstructed volumes suffer from the following:
·
The
3D reconstructed volume consists of dozens of slices that have relatively
large thickness (e.g., 1~3 mm depending on the tomosynthesis system), on
the other hand, the in-plane resolution (parallel to the detector plane)
is small (e.g., 0.1 mm × 0.1 mm). This problem could lead to an error of
the conventional 3D mass detection approaches, which processes 3D
information with different resolutions at the same time.
·
The
limited angular range and the limited number of projection views that are
used in the DBT systems cause reconstruction artefacts when
reconstructing the 3D volume. Therefore, an object in the out-of-focus
plane is blurred, as can be seen in figure 1.
·
A
larger amount of information in the 3D DBT data should be analyzed by
radiologists, which causes a substantial increase in the workload and the
possibility for overlooking subtle lesions.
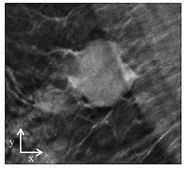
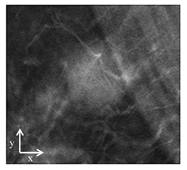
Fig.
1. Cross sectional view image
of an invasive lobular carcinoma. (a) Cross sectional view in the y-z
plane. There is the strong reconstruction artefact in this plane. (b) Cross
sectional view in the in focus x-y plane, clearly showing the mass
lesion. (c) Cross sectional view in the out-of-focus x-y plane, showing a
blurred object due to the reconstruction artefact
In this work, to help radiologists detect
cancerous efficiently, a novel mass detection approach using slice
conspicuity in the 3D reconstructed DBT volumes is proposed to deal with
the aforementioned DBT problems with the following considerations:
·
The
proposed approach solves the limited resolution problem on the quasi-3D
domain by employing the detection of regions of interest (ROIs) on each
reconstructed slice independently. In parallel, depth directional
information is separately utilized to combine the ROIs of reconstructed
slices.
·
The
proposed approach resolves the problem of blur in the out-of-focus
planes, by performing feature analysis on the in-focus slices only. To
that end, the blurriness of each slice was measuring and selecting in
focus slices.
2. Proposed
mass detection in DBT
2.1 Overview
As shown in figure 2, the proposed mass
detection consists of the following two phases:
·
Segmentation
of masses and VOI detection from a given 3D reconstructed digital breast
volume
·
Feature
extraction and classification of the detected VOIs for reducing the
number of False Positives (FPs)
(a)
Volume of interest (VOI) detection
(b)
False positive (FP) reduction
Fig.
2. Overall process of the proposed mass detection method
2.2
Segmentation of masses and VOI detection from a given 3D reconstructed
digital breast volume
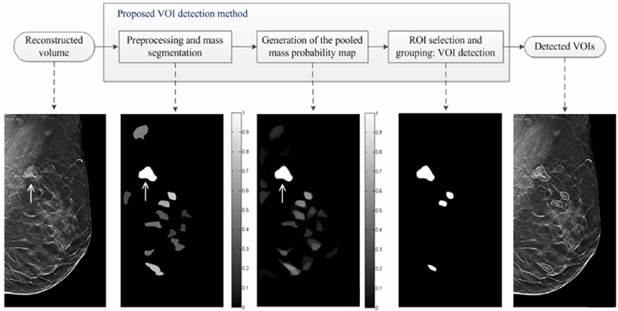
Step 1. Preprocessing and mass segmentation:
·
For the purpose of increasing the detection
performance, a mammographic mass enhancement technique is applied to each
reconstructed slice.
· Then, mass regions are segmented by considering
the nesting patterns of iso-contours, as well as the gradient between the
iso-contours, to characterize mass objects.
Step 2. Generation of the pooled mass probability
map:
Masses
have high correlation between reconstructed slices as they are likely to
be detected in the same location in adjacent reconstructed slices. The
depth directional correlation between the reconstructed slices to combine
the slice information is utilized by considering the following:
·
Let  denote
as ROI representing the j-th ROI on the i-th reconstructed
slice. The mass probability for can
be written as denote
as ROI representing the j-th ROI on the i-th reconstructed
slice. The mass probability for can
be written as
|

|
(1)
|
· A mass probability map  on i-th reconstructed slice that
represents the mass saliency of a given location (x, y) is defined as on i-th reconstructed slice that
represents the mass saliency of a given location (x, y) is defined as
|

|
(2)
|
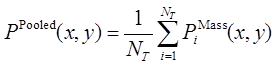
· we generate a pooled mass probability map  Pooled by averaging mass probability maps over
all slices as Pooled by averaging mass probability maps over
all slices as
|
|
(3)
|
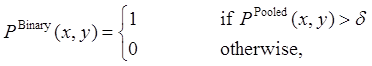
Step 3. ROI selection and grouping: VOI
detection:
Figure
3 illustrates how the ROIs are grouped and the mass VOIs are detected. to
determine mass candidates, a mass binary map  is
obtained by thresholding the pooled mass probability map as follows: is
obtained by thresholding the pooled mass probability map as follows:
|
|
(4)
|
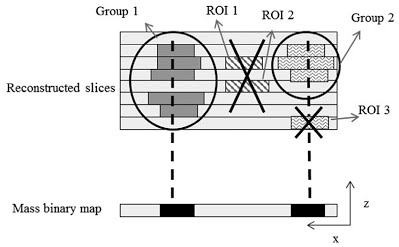
Fig.
3. Illustration of an example for grouping the ROIs and detecting VOIs
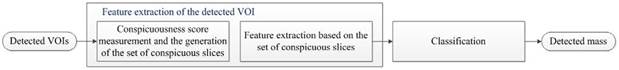
2.3 Feature extraction and classification of the
detected VOIs for reducing the number of False Positives (FPs)
To extract features that well describe the mass lesions, features are extracted only from
the central slice; where the mass is most conspicuous. The maximum
conspicuous score is calculated by taking the average of the gradient at
the edge mass edge margin as shown in the figure 4. The average gradient
is calculated according from the gradient image in the margin region
shown in figure 4.b.
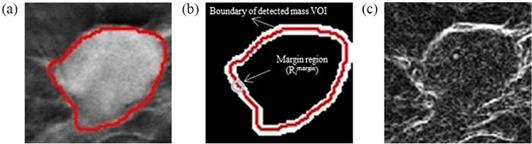
Fig.
4. Calculating the conspicuously score from each slice. (a) Detected mass
(b) Margin region of the detected mass. (c) Gradient magnitude image.
Finally, the features are
extracted form mass slices that have a mass conspicuous score above a
certain value as shown in figure 5.
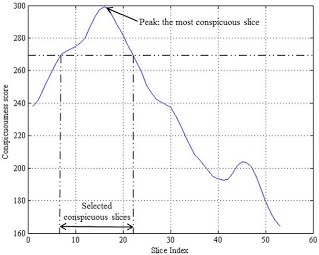
Fig.
5. Overall process of the proposed mass detection method
3. Experiments & Result
Figure 6 shows an example of
the detected masses with the proposed method. The first row shows the
original ROIs containing a mass, While the second row shows the masses
marked with the proposed VOI detection method. As a reference, the last
row shows the masses with the outlines manually marked by radiologists.
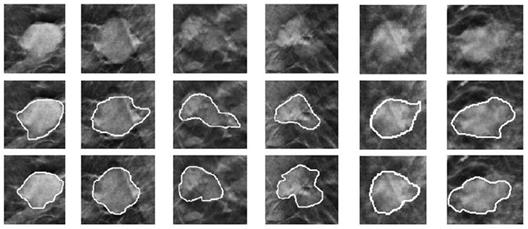
Fig.
6. Examples of detected masses with the proposed method
To evaluate the proposed detection method, FROC
curve was used. As can be seen in the FROC curve shown below, the
sensitivity of the proposed VOI detection method is higher than the sensitivity
of the commonly used 3D multilevel thersholding method for all false
positive rates.
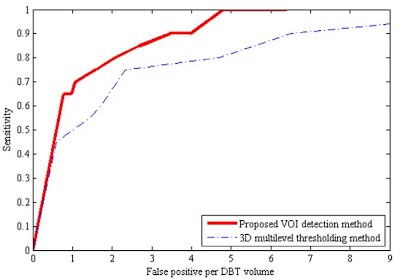
Fig.
7. Detection performance comparison using FROC curve
Moreover, the proposed feature extraction method
using the most conspicuous slice performs better than conventional 3D
features as can be seen in the ROC curve shown below. It should be noted
that the sensitivity of the detection further improves when combining the
proposed features with conventional features extracted from the most
conspicuous slice.
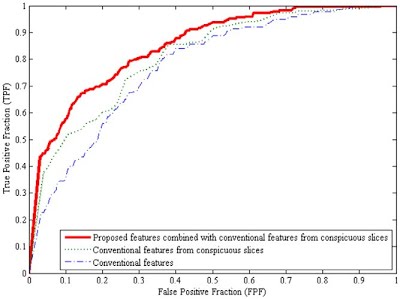
Fig.
8. Effectiveness of the proposed conspicuous slice pooling based features
extraction method using ROC curves
|