|
1.
Introduction
l
Digital breast
tomosynthesis (DBT) is a new 3-D imaging modality that utilizes a
limited-angle tomography technology to provide quasi 3-D structural
information of the breast.
l
DBT has been found to be
superior to the full-field digital mammography (FFDM) in detecting and
diagnosing cancerous lesions of breast.
l
Currently, as approved
by the U.S. Food and Drug Administrator (FDA), DBT has been used in
combination with FFDM.
l
Recent studies have shown that this combined
procedure significantly increases the reader performance in screening
practice. However, in combined procedure, the interpretation time of
radiologist is increased and the radiation dose to breast being imaged is
increased at about twice compared to the that of FFDM alone.
l
To overcome the above
drawbacks of combined procedure, recent studies have focused on
synthesizing 2-D images from 3-D DBT volume to eliminate the need to
acquire a separable FFDM with its accompanying doubled dose rate.
l
If 2-D synthetic image
is successfully generated from 3-D DBT volume, we can dramatically reduce
the radiation dose rate and shooting time in screening.
l
For this purpose, in
this paper, we propose a novel 2-D synthetic image generation method
which improves the conspicuity of lesions.
l
The conspicuity of
lesions is important in screening because it is related to the
radiologist’s performance.
l
To generate the
conspicuity-improved 2-D synthetic image, we utilizes the observation
that the boundary of the masses and microcalcifications as well as edge
of the vasculature (e.g. venous structures) have large intensity
differences with surrounding tissues.
2. Proposed Synthetic Image Generation Method
In order to generate conspicuity-improved 2-D synthetic
image, we select the voxels that have large intensity differences with
surrounding tissues. The selection is performed on the proposed
conspicuity volume that shows conspicuity of voxels. The details are
described in the following subsections.
A. Generation of
Conspicuity Volume
We generate the conspicuity volume that represents the
degree of importance in terms of the conspicuity. We utilize the gradient
value of DBT volume. A 3-D gradient magnitude volume  is obtained
as follows: is obtained
as follows:
|
 , ,
|
(1)
|
where  denotes the
input DBT volume and denotes the
input DBT volume and  is the
scaling parameter to assign the weight in depth directional intensity
changes. is set to 2
in the experiment. is the
scaling parameter to assign the weight in depth directional intensity
changes. is set to 2
in the experiment.
The conspicuity volume  is obtained
by taking local average of the 3-D gradient magnitude volume as is obtained
by taking local average of the 3-D gradient magnitude volume as
|
 , ,
|
(2)
|
where symbol  represents
the 3-D convolution operation and represents
the 3-D convolution operation and  denotes the
3-D Gaussian kernel. The parameters of denotes the
3-D Gaussian kernel. The parameters of  , ,  , and , and  are set to
3mm in experiment. The local average with the convolution is performed to
increase the correlation among neighboring voxels. are set to
3mm in experiment. The local average with the convolution is performed to
increase the correlation among neighboring voxels.
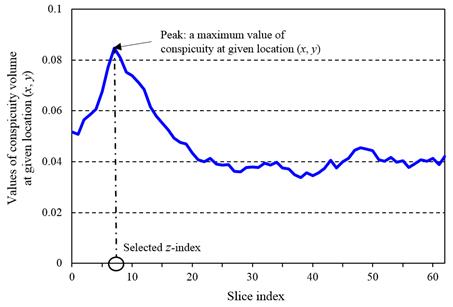
Figure 1.
Selecting the z-index of voxel for a given (x, y) coordinate using values
in conspicuity volume.
B. New Synthetic
Image Generation
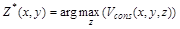
To generate the conspicuity-improved synthetic images, a voxel
is selected in the conspicuity volume, which has maximum value of
conspicuity at given location (please see
Fig. 1). The z-index of voxel for generating synthetic image can be
determined by (please see
Fig. 1). The z-index of voxel for generating synthetic image can be
determined by
|
 , ,
|
(3)
|
The maximum conspicuity index map  is
estimated as is
estimated as
|
 , ,
|
(4)
|
where the function  denotes the 3-by-3 median filter operation to remove
the pepper noise in the maximum conspicuity index map. Finally, each
pixel value in the 2-D synthetic image denotes the 3-by-3 median filter operation to remove
the pepper noise in the maximum conspicuity index map. Finally, each
pixel value in the 2-D synthetic image  is
determined by selecting the voxel value of the 3-D DBT volume as follows: is
determined by selecting the voxel value of the 3-D DBT volume as follows:
|
 . .
|
(5)
|
3. Experiment
A. Quality
Measurement
1) Global
Sharpness
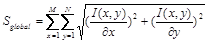
To measure the conspicuity of overall anatomical structures
including vasculature, the global sharpness of synthesized images was
calculated using the Tenegrad measurement. The Tenegrad measurement is
known as the optimal method for evaluating the sharpness of the image. It
can be calculated by
|
 , ,
|
(6)
|
where I denotes the synthesized image of M N size,. The global sharpness is increased as details
(e.g., vasculatures) are more visible in the image. N size,. The global sharpness is increased as details
(e.g., vasculatures) are more visible in the image.
2) Sharpness of
Mass Boundary
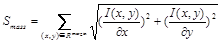
To measure the conspicuity of masses in terms of
discernibleness from the distinct boundary, the sharpness of mass
boundary in synthesized images is defined as follows:
|
 , ,
|
(7)
|
where  denotes the margin region obtained by constructing a
band of pixels along the boundary of mass. denotes the margin region obtained by constructing a
band of pixels along the boundary of mass.
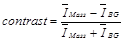
3) Contrast
For the purpose of measuring the conspicuity induced from
the intensity difference with surrounding tissues, we measure the
contrast of mass lesions. The contrast of mass lesions is given by
|
 , ,
|
(8)
|
where  denotes the
mean pixel value in mass lesions and denotes the
mean pixel value in mass lesions and  is the mean
of the background pixels in the neighborhood of the object. The contrast
is increased when the conspicuity of mass is improved e.g., the intensity
difference between mass lesion and background is increased. is the mean
of the background pixels in the neighborhood of the object. The contrast
is increased when the conspicuity of mass is improved e.g., the intensity
difference between mass lesion and background is increased.
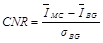
4) Contrast to
Noise Ratio (CNR)
The CNR of microcalcifications in synthesized images was
calculated to measure the conspicuity of microcalcifications [2]. The CNR
value is defined as
|
 , ,
|
(9)
|
where  denotes the
mean pixel value of the selected microcalcifications and denotes the
mean pixel value of the selected microcalcifications and  is the
standard deviation of the background pixels in the neighborhood of the object.
The CNR is increased when the conspicuity of microcalcification is
improved, e.g., intensity difference between microcalcifications and
background is increased. is the
standard deviation of the background pixels in the neighborhood of the object.
The CNR is increased when the conspicuity of microcalcification is
improved, e.g., intensity difference between microcalcifications and
background is increased.
B. Experimental
Results
l
As shown in the results
of the Table I, the image quality of the proposed method outperforms MIP
and average projection for all four types of quality indices.
l
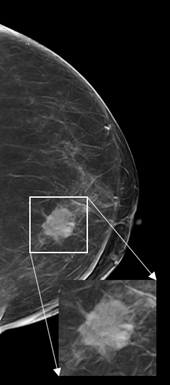
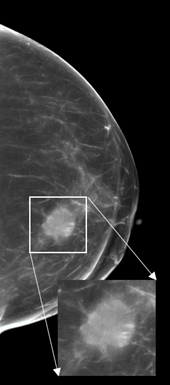
As shown in Fig. 2, mass
lesions are the best visible in the synthetic image generated by the proposed
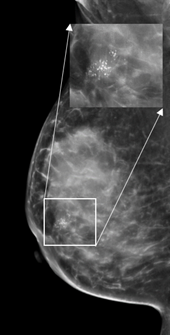
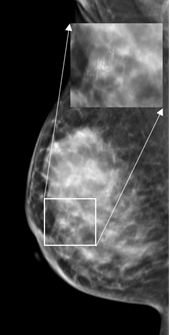
method. Fig. 3 shows that microcalcification clusters are clearly visible
in the proposed synthetic image.
Table 1.
Comparion of Measured Performances of Three Image Synthesizing Methods.
|
Measurement
|
Synthesizing
method
|
Performance
|
p-value
|
|
Global sharpness
|
Proposed method
|
0.0148 0.0005 0.0005
|
|
|
|
MIP
|
0.00820.0002
|
<
0.0001
|
|
|
Average projection
|
0.00240.0001
|
<
0.0001
|
|
|
Sharpness of mass
boundary
|
Proposed method
|
0.05090.0030
|
|
|
|
MIP
|
0.02270.0015
|
<
0.0001
|
|
|
Average projection
|
0.00980.0007
|
<
0.0001
|
|
|
Contrast
|
Proposed method
|
0.22130.0093
|
|
|
|
MIP
|
0.14210.0065
|
<
0.0001
|
|
|
Average projection
|
0.17910.0082
|
0.0012
|
|
|
CNR
|
Proposed method
|
0.60530.0440
|
|
|
|
MIP
|
0.53430.0396
|
0.2456
|
|
|
Average projection
|
0.19090.0245
|
0.0001
|
|
|
|
|
|
|
|
|
Figure 2.
Synthesized 2-D craniocaudal images demonstrate an irregular and
hypoechoic mass with speculated margins in a left breast of woman. Images
are generated by (a) the proposed method, (b) the MIP, and (c) the
average projection.
Figure 3.
Synthesized 2-D mediolateral oblique images demonstrate clustered
distribution of fine linear branching calcifications in a right breast of
woman. Images are generated by (a) proposed method, (b) the MIP, and (c)
the average projection.
4. Conclusion
l
A novel
conspicuity-enhanced synthetic image generated from 3-D DBT.
l
Comparative experiments with
other synthetic images demonstrated that the lesions were most
conspicuous in the proposed synthetic image.
|