|
1. Introduction
·
In
this work, we devise a novel method to enhance the microcalcifications
(MCs) in the digital breast tomosynthesis (DBT) projection views (PVs)
for MC cluster detection purposes.
·
We
propose utilizing the correlation between the PVs such that:
1.
The
contrast of MCs is improved.
2.
Image
noise due to the low X-ray exposure in DBT is minimized.
3.
The
false positive (FP) MC cluster detection is reduced.
2. Proposed
microcalcification multi-shift enhancement
2.1. Overview

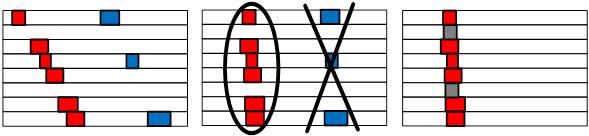
Figure
1: The correlation between stacked PVs (enhanced PVs).
(a)
The observed shift in MCs across the PVs. (b) Aligned PVs according to
the shift
·
Figure
1 shows a stack of enhanced PVs, in which the correlation between the PVs
is apparent. From the PVs, we can have two main observations:
1.
The
breast region shifts along the tube motion direction in each PV.
2.
The
small bright shape of MCs appears shifted in each PV with a constant
shift based on their depth in the breast.
·
A
multi-shift enhancement is devised to utilize those shifts in order to
improve the MC contrast and reduce the PVs noise. The enhancement is
performed by two enhancement steps described below:
2.2. Coarse Shift Enhancement
·
The
coarse shift is the shit in the breast region between the PVs
·
Estimated
by block-matching at N critical points.
·
The
coarse shift (dcoarse) is the average of all critical points
shifts.
·
The
standard deviation (σcoarse) of all critical points shift is
calculated.
2.3. Fine Multi-shift Enhancement
·
To
enhance the MCs at the i-th PV:
·
All
PVs are shifted with respect to the i-th PV within [ -σcoarse
,+ σcoarse]
·
Average
pooling of the PVs at each shift to suppress random noise.
·
2D
Laplacian of Gaussian filtering to improve MC like particles.
·
Obtain
the enhanced i-th PV by maximum pooling across the PVs.
3. Microcalcification cluster
detection and false positive reduction
·
MC clusters are detected via iterative thresholding on
the enhanced PVs followed by clustering.
·
FPs are rejected and missing ROIs are compensated as
shown in figure 2.
·
Finally, to determine the malignancy of the MC cluster,
features are extracted from each ROI and in the PVs, and classification
fusion is utilized.
Figure
2: FP reduction and missing ROI compensation
4. Experiments
4.1 Dataset
To evaluate this work, a dataset consisting of 46 PV
sets of both MLO and CC views collected form 23 patients. Each PV set
consists of 15 PV images and has the fixed pixel size of 140 µm × 140 µm.
From the provided PV sets, 20 had a biopsy proven malignant MC cluster.
4.2 Experimental results
|
|

|
|
|
Box-Rim
Filter
|
Difference
of Gaussian (DoG)
|
Proposed
Multi-shift enhancement
|
|
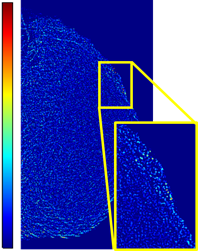
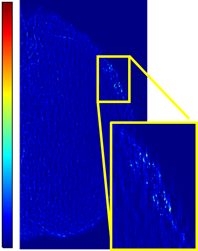
Figure
3: Example of different
enhancements results, and the average contrast to noise ratio around
the true MCs (Average MC CNR)
|
To demonstrate the effectiveness
of the proposed PV enhancement technique, we show a comparison with the
recently proposed methods in recent literature. As clearly shown in
figure 3, The proposed PV enhancement technique improves the contrast of
the MCs while it suppresses the noise and the breast tissue. This results
in an improvement in the detectability of the MCs. Moreover, to
quantitatively evaluate the MC contrast enhancement achieved by the
proposed PV enhancement method, CNR was calculated around the MCs and the
average of the MC CNR values is shown in table 1.
|
Table 1:
Comparison of average MC Cluster CNR values
|
|
Approach
|
Box-Rim
Filter
|
Difference
of
Gaussian
(DoG)
|
Proposed
Multi-shift
enhancement
|
|
Average
MC CNR
|
1.648
|
1.195
|
2.027
|
Finally, we show, in figure 4,
an FROC curve representing the detection sensitivity of the proposed method.
The results demonstrated that the proposed approach increases contrast of
MCs and improves the detection sensitivity with a low FP rate.
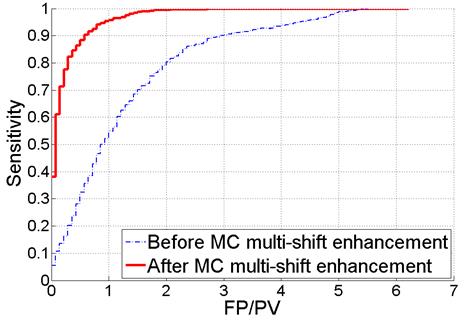
Figure 4: Detection performance in terms of the
FROC curve
|

